Raw Data
Table 1. A table showing an example of how the raw data is organized
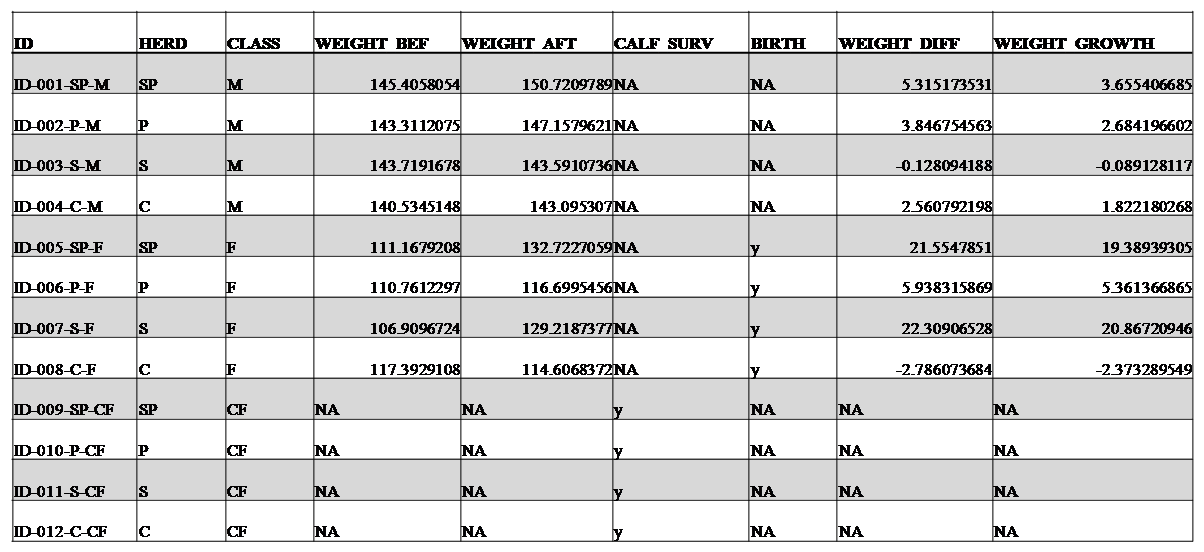
Each record on the table represents one caribou individual. The second column on the table represents which herd the individual was a part of, and therefore which type of management it was subject to. This indicates whether the individual was part of a
supplemental feeding herd (S or S2), a predator control herd (P or P2), a herd with both predator control and supplemental feeding (SP or SP2), or a control herd which was not subject to either management method(C or C2). This is a categorical predictor variable. The variable 'CLASS' is another categorical predictor variable which refers to whether an individual was an adult female (F), adult male (M), or a calf (CF). We measured body weight of the adult caribou (kg) as a response variable as well as number of births and number of surviving calves. Weight was measured in kilograms and was only recorded for the adults. The variable 'CALF_SURV' indicates whether the calf survived (y or n). The 'BIRTH' variable indicates whether or not a female gave birth to a calf during that season (y or n). 'WEIGHT_DIFF' refers to the difference in the weight of an individual before and after the study, and 'WEIGHT_GROWTH' refers to the percent increase in weight over the season.
supplemental feeding herd (S or S2), a predator control herd (P or P2), a herd with both predator control and supplemental feeding (SP or SP2), or a control herd which was not subject to either management method(C or C2). This is a categorical predictor variable. The variable 'CLASS' is another categorical predictor variable which refers to whether an individual was an adult female (F), adult male (M), or a calf (CF). We measured body weight of the adult caribou (kg) as a response variable as well as number of births and number of surviving calves. Weight was measured in kilograms and was only recorded for the adults. The variable 'CALF_SURV' indicates whether the calf survived (y or n). The 'BIRTH' variable indicates whether or not a female gave birth to a calf during that season (y or n). 'WEIGHT_DIFF' refers to the difference in the weight of an individual before and after the study, and 'WEIGHT_GROWTH' refers to the percent increase in weight over the season.
Exploratory Graphics
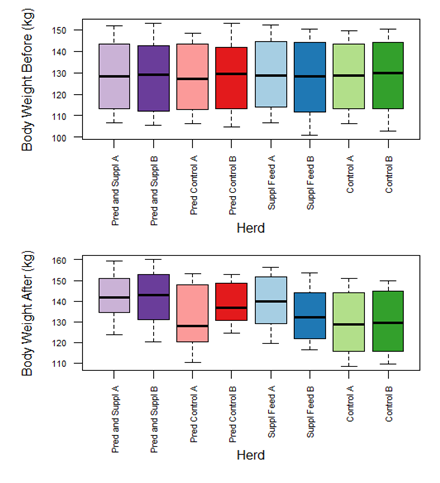
Figure 2. Boxplots displaying the body weight for each herd before and after the three month period. "Pred and Suppl" refers to the herds which received both predator control and supplemental feeding.
We plotted the starting weights and the final weights of the caribou for each herd in a boxplot to effectively visualize the distribution. The median of the final weight showed an increase from the starting weight for each herd. The herds with both predator control and supplemental feeding showed the greatest increase in weight. The range of the distribution of body weight was smaller after the study.

Figure 3. A histogram showing the distribution of starting weight across all herds
|
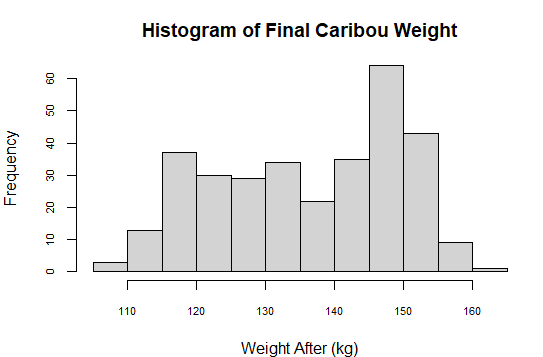
Figure 4. A histogram showing the distribution of final body weight across all herds
|
The distribution of the final weight and starting weight for all caribou is shown above in two histograms. Both histograms show a bimodal distribution, however the histogram of starting weight shows a stronger bimodal shape. This bimodal shape is a result of the difference in weight of males and females. It appears that this difference is smaller in the distribution of final body weight, as females substantially increased in weight.

Figure 5. Boxplots showing the change in body weight for each herd. "Pred and Suppl" refers to the herds which received both predator control and supplemental feeding.
Since our study is concerned with the change in caribou weight, we plotted the difference between the starting weight and final weight for each herd. The boxplots above show the distribution of the change in body weight for each herd. It is evident from these boxplots that all herds showed an overall increase in body weight. The herds with both predator control and supplemental feeding showed the greatest increase in weight. The herds that received only predator control were similar to the herds that only received supplemental feeding. The control groups showed very little change.
Table 2. Summary statistics for change in body weight (kg)

This table shows the summary statistics for the change in weight of adult caribou over all four herds. It was quite variable, and had a large range due to the varying management practices implemented.

Figure 6. A histogram showing the distribution of the change in body weight across all herds
We plotted the distribution of the change in body weight for all caribou as a histogram. This shows a median increase of 6.93kg across all caribou from all herds. There was a wide distribution of results due to the difference in management techniques.
|
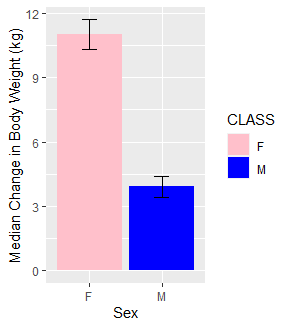
Figure 7. Boxplots showing the distribution of the change in weight for male and female adults
The change in weight was plotted as a boxplot for males and females in order to determine if the study was more successful for one sex over the other. Males gained less weight than females on average which is likely due to pregnancy in females.
|
Assumptions
Before the ANOVA was conducted, we had to consider whether the study met the assumptions of normality, homogeneity of variances, and independence. The residuals were not highly skewed, so the assumption of normality was not violated. Additionally, a residual plot was checked to ensure that the assumption of homogeneity of variances was not violated. Lastly, we made sure that the assumption of independence was met by using two herds for each treatment level. The study was designed this way to ensure that we had two truly independent groups for each treatment.
